It’s not your imagination. Kansas City temperatures are hotter than they used to be.

“What’s your KC Q” is a joint project of the Kansas City Public Library and The Kansas City Star. Readers submit questions, the public votes on which questions to answer, and our team of librarians and reporters dig deep to uncover the answers.
Have a question you want to ask? Submit it now »
by Robert A Cronkleton
It’s not just you — Kansas City is getting warmer. Thursday’s highs climbed into the 90s, and we are having more and more of those days.
And precipitation is on the rise, as well.
“I think it’s starting to get warmer and warmer and I’ve noticed maybe over the last five to 10 years more and more swings in the weather,” said Tom Arnhold, a trained weather spotter who grew up on a farm in western Kansas.
Weather has always piqued the interest of Arnhold, now living in Olathe.
So he asked “What’s Your KCQ?,” a collaboration between The Star and the Kansas City Public Library, how much have the average temperatures in Kansas City increased in the last 25 years?
His question was submitted when KCQ asked what Kansas Citians wanted to know about Midwest weather as storm season and summer heat descends on the area. If you have a question of your own, you can ask here or fill out the form below.
This one is timely as new “climate normals” for Kansas City and the rest of the nation — only released once a decade — came out last month.
The new data supports Arnhold’s suspicion: Kansas City has gotten warmer. And it’s also gotten wetter. But by how much?
Average temperature nationwide increases
Every 10 years, the National Oceanic and Atmospheric Administration resets what defines normal weather conditions for daily, monthly and annual climate conditions for thousands of locations across the United States.
New averages are calculated for such things as temperatures, rainfall and snowfall, as well as other conditions, based on the analysis of weather conditions over the past three decades.
The latest figures were released early in May and will be used over the next 10 years to compare daily weather conditions. They are the numbers that local meteorologists will reference when they talk about the weather being above or below average.
For the past decade, the averages have been based on weather observations from 1981 to 2010. The new collection of data is based on weather that occurred from 1991 to 2020.
Because the new data overlaps with the previous version, the changes are subtle — but not insignificant. There is an upward shift in temperature averages, according to the National Centers for Environmental Information.
The 1981-2010 average temperature for the contiguous U.S. was 52.8 degrees while the new average temperature is 53.3 degrees.
It may not seem like some massive shift, but the new average temperature is the warmest on record for the country.
Even a half degree globally could expose tens of millions more people worldwide to life-threatening heat waves, water shortages and coastal flooding, according to a New York Times story and interactive graphic based on a 2018 United Nation’s Report.
Extreme weather events such as heat waves and large storms are likely to become more frequent or more intense.
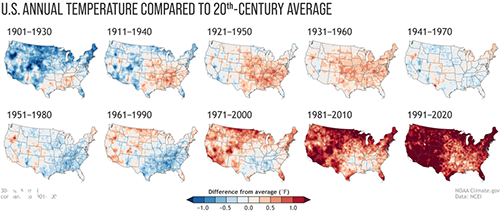
annual average U.S. temperature compared to the 20th-century average for each U.S. Climate
Normals period from 1901-1930 (upper left) to 1991-2020 (lower right).
National Oceanic and Atmospheric Administration/National Centers for Environmental Information
However, not all of the nation is seeing an increase in temperatures. The north-central part of the U.S. saw temperatures cool, especially in the spring. Meanwhile the south and southwest are considerably warmer. The west and the East Coast are also warmer, according to the National Centers for Environmental Information.
An analysis by NASA scientists found that last year tied with 2016 as the warmest year on record, continuing the planet’s warming trend. The last seven years have been the warmest seven years on record.
When it comes to precipitation, there’s no clear trend on whether locations are wetter or drier, according to the National Oceanic and Atmospheric Administration.
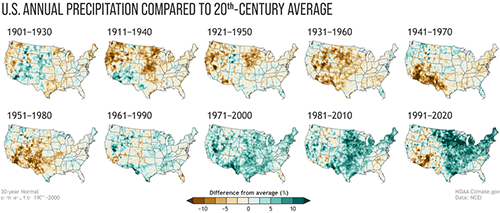
U.S. Climate Normals period from 1901-1930 (upper left) to 1991-2020 (lower right).
National Oceanic and Atmospheric Administration's Climate.gov
Kansas City area’s new normal
The average temperature for Kansas City has risen — and we’re seeing more hot days than before, according to data collected at Kansas City International Airport
The new average annual temperature for Kansas City is 54.7 degrees, which was up slightly from the 1981-2010 average temperature of 54.6 degrees.
This year, NOAA also provided an average temperature for the past 15 years, which covers 2006 to 2020. The average temperature for that period was 55.1 degrees, half a degree difference from the 1981-2010 average.
While the increase isn’t much, it shouldn’t be dismissed, said Brent Pesel, meteorologist at the National Weather Service in Pleasant Hill.
“It is very significant when it comes to analyzing season trends, especially when we’re looking at, temperature-wise, the effects of extreme heat,” he said.
“Sometimes during the summer, especially here, it can get pretty hot. If we’re seeing a general increase in seasonal temperatures, then we can use that and say it looks like we might see more cases of heat waves throughout the central United States.”
Because 20 years of weather data is included in both sets of climate norms, the changes are expected to be rather subtle.
“I’d be really concerned if it swung by several degrees,” Pesel said.
When it comes to precipitation, Kansas City saw its average precipitation increase from 38.86 inches in the previous 30-year-period to 39.3 inches to the new period.
In the 15-year period, the average annual precipitation has increased to 39.91 inches, a difference of 1.05 inches from the 1981-2010 period, according to the data.
Other climate data highlights
Kansas City’s winter season saw the largest increase in average temperature, up .7 degrees from 31.2 degrees to 31.9 degrees. The other seasons remained relatively the same.
The new average temperature for each season is 54.6 degrees in the spring, 76.3 degrees in the summer, 56.1 degrees in the fall and 31.9 degrees in the winter.
But the 15-year period hints that most of the seasons are getting even warmer. According to that data set, the average temperature for each season is 55.3 degrees in the spring, 76.9 degrees in the summer, 56.6 degrees in the fall and 31.7 degrees in the winter.
Speaking of winter, Kansas City is seeing a little less snow as the average annual snowfall dipped from 18.8 inches in the previous 30-year-period to 18.2 inches in the new period.
Kansas City is also seeing more really cold days. The average number of days in a year where the minimum temperatures fell below 20 degrees increased 1.6 days, from 39.4 in the previous period to 41 in the new 30-year-period.
For the 15-year period, the annual average is 43.8 days.
The number of hot days also increased. The average number of days per year where the maximum temperature rose above 90 degrees increased 3.7 days from 32.6 days in the 1981-2010 period to 36.3 days in the new period.
For the 15-year-period, the annual average is 38.3 days.
Kansas City area by the numbers
Here’s a closer look at communities in the Kansas City area over the 30-year period:
Kansas City Wheeler Downtown Airport:The annual average temperature increased .2 of a degree from 56.7 to 56.9 degrees. The annual maximum temperature increased .3 of a degree from 66 to 66.3 degrees. The annual minimum temperature remained unchanged at 47.5 degrees.
The annual average precipitation decreased .93 of an inch from 39.06 to 38.13 inches.
Atchison: The annual average temperature increased .4 of a degree from 53.8 to 54.2 degrees. The annual maximum temperature increased .6 of a degree from 63.3 to 63.9. The annual minimum temperature increased .3 of a degree from 44.2 to 44.5 degrees.
The annual average precipitation decreased .34 of an inch from 36.72 to 36.38 inches.
Bonner Springs: The annual average temperature decreased .1 of a degree from 53.7 to 53.6 degrees. The annual maximum temperature decreased .8 of a degree from 65 to 64.2. The annual minimum temperature increased .5 of a degree from 42.5 to 43 degrees.
The annual average precipitation decreased .2 of an inch from 40.73 to 40.53 inches.
Clinton: The annual average temperature increased .2 of a degree from 55.1 to 55.3 degrees. The annual maximum temperature increased .6 of a degree from 66.2 to 66.8. The annual minimum temperature decreased .1 of a degree from 44 to 43.9 degrees.
The annual average precipitation decrease 1.68 inches from 45.01 to 43.33 inches.
Independence: The annual average temperature dropped .5 of a degree from 54.5 to 54 degrees. The annual maximum temperature decreased .7 of a degree from 64.8 to 64.1 The annual minimum temperature decreased .1 of a degree from 44.1 to 44 degrees.
The annual average precipitation increased nearly an inch from 43.67 to 44.66 inches.
Kearney: The annual average temperature increased .4 of a degree from 53.3 to 53.7 degrees. The annual maximum temperature increased .2 of a degree from 64.9 to 65.1. The annual minimum temperature increased .5 of a degree from 41.8 to 42.3 degrees.
The annual average precipitation increased .06 of an inch from 41.15 to 41.21 inches.
Lawrence: The annual average temperature increased .6 of a degree from 54.3 to 54.9 degrees. The annual maximum temperature decreased .2 of a degree from 64.9 to 64.7. The annual minimum temperature increased 1.4 degrees from 43.7 to 45.1 degrees.
The annual average precipitation decreased .49 of an inch from 39.89 to 39.4 inches.
Lee’s Summit: The annual average temperature increased .9 of a degree from 54.8 to 55.7 degrees. The annual maximum temperature increased .3 of a degree from 64.8 to 65.1. The annual minimum temperature increased 1.6 degrees from 44.7 to 46.3 degrees.
The annual average precipitation decreased 3.84 inches from 42.18 to 38.34 inches.
Leavenworth: The annual average temperature increased .8 of a degree from 55 to 55.8 degrees. The annual maximum temperature increased .5 of a degree from 65.8 to 66.3. The annual minimum temperature increased 1 degree from 44.3 to 45.3 degrees.
The annual average precipitation decreased 1.64 inches from 42.91 to 41.27 inches.
Olathe (New Century AirCenter): The annual average temperature increased .3 of a degree from 54.8 to 55.1 degrees. The annual maximum temperature increased .2 of a degree from 65.4 to 65.6 degrees. The annual minimum temperature increased .3 of a degree from 44.3 to 44.6 degrees.
The annual average precipitation decreased 2.3 inches from 40.04 to 37.74 inches.
Pleasant Hill: The annual average temperature increased .8 of a degree from 54.4 to 55.2 degrees. The annual maximum temperature increased .2 of a degree from 64.8 to 65. The annual minimum temperature increased 1.4 degrees from 44 to 45.4 degrees.
The annual average precipitation decreased .23 of an inch from 42.91 to 42.68 inches.
Smithville Lake: The annual average temperature decreased .5 of a degree from 53.5 to 53 degrees. The annual maximum temperature decreased .3 of a degree from 63.6 to 63.3. The annual minimum temperature dropped .8 of a degree from 43.5 to 42.7 degrees.
The annual average precipitation increased .06 of an inch from 39.97 to 40.03 inches.
St. Joseph: The annual average temperature increased .3 of a degree from 53.4 to 53.7 degrees. The annual maximum temperature increased .5 of a degree from 64.3 to 64.8. The annual minimum temperature increased .1 of a degree from 42.4 to 42.5 degrees.
The annual average precipitation decreased .84 of an inch from 35.6 to 34.76 inches.
Submit a Question
Do you want to ask a question for a future voting round? Kansas City Star reporters and Kansas City Public Library researchers will investigate the question and explain how we got the answer. Enter it below to get started.